

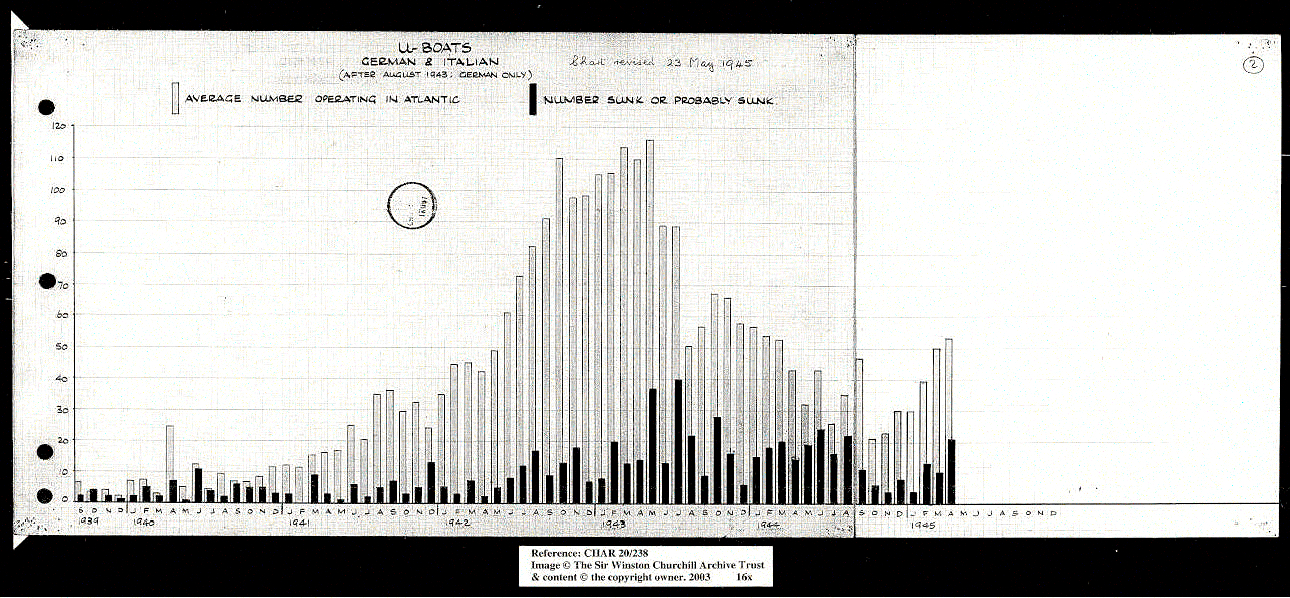
Chart of numbers of German U-boats in operation and sunk in the Atlantic Ocean
Churchill Archives Centre, Cambridge, UK. CHAR 20/238/3
A chart provided by British Naval Intelligence to British Prime Minister Winston Churchill in 1945.
The bar chart shows the estimated number of German U-boats operating in the Atlantic Ocean increased slowly to 35 in January 1942, then increased sharply to 110 by October 1942. Estimated U-boat numbers in the Atlantic peaked at 116 in May 1943, then dropped to 51 in August 1943. Sinkings of U-boats averaged around 5 per month until June 1942, then increased to a peak of 40 per month in July 1943.
Accurate information on the German U-boat threat was vital to Allied naval planning for the Battle of the Atlantic.